Aerial survey reports shows increase of birds, wetland habitat
Published 11:40 am Tuesday, December 27, 2022

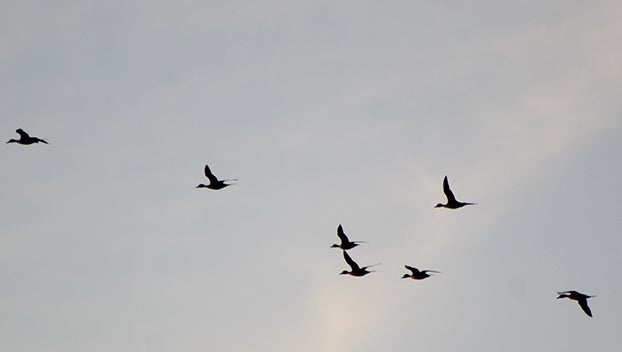
- A flock of pintail ducks fly over The Swamp area of St. Catherine Creek National Wildlife Refuge at the Sibley Unit. (Hunter Cloud | The Natchez Democrat)
|
Getting your Trinity Audio player ready...
|
JACKSON — Houston Havens and Darrin Hardesty, with the Mississippi Department of Wildlife, Fisheries and Parks waterfowl program, were able to conduct aerial surveys of waterfowl in the Mississippi Delta from December 15 to December 19. The monthly survey shows insight to the migration of waterfowl for the hunting season.
Weather delays impacted the timing of the survey but wetland habitat saw an increase in availability, the report states. Waterfowl responded to these new areas of flooding but agricultural fields had recently been disked limiting the food availability for the birds.
Havens and Hardesty said there is still opportunity for hunters, landowners and habitat managers to capture water and provide adequate habitat for wintering waterfowl. Wetland availability was greatest in the Northeast portion of the Mississippi Delta and the least in northwest and southwest regions.
Duck numbers did increase from the November survey but the abundance was lower than the long term average for December. Reports from hunters afield indicated these numbers perhaps grew with the winter weather which hit the US starting Thursday and into Saturday of last week.
Dabbling ducks outside of Mallards made up 56 percent of the duck observations. Wood ducks and northern pintails highlighted the observations with above average numbers.
Northern Shovelers and Scaup were some of the highest observed duck species due to their use of aquaculture ponds. Multiple groups of Canvasbacks were also seen. Mallards were most concentrated in the northeast part of the Delta and the southeast had the majority of other dabblers and diving ducks.
Half of Mississippi’s duck season remains and peak numbers of waterfowl are typically observed in January.
Table showing duck observations for December 2022 and the Long Term Average
| Ducks | Mallards | Dabblers | Divers | Total |
| December 2022 | 44,554 | 155,597 | 73,045 | 273,196 |
| Long Term Average | 123,848 | 271,232 | 124,883 | 519,963 |


